Bhabishya Neupane
Search
Categories
All
(7)
R Shiny
(3)
SBIR
(1)
Tidy Tuesday
(4)
Time Series Forecasting
(1)
USgas
(1)
crosstalk
(1)
ggplot2
(2)
infer
(1)
leaflet
(2)
pkgdown
(1)
r package
(1)
reactable
(1)
reactablefmtr
(1)
usethis
(1)
widyr
(1)
About Me
Hi all! I am Bhabishya Neupane and welcome to my data science portfolio.
Order By
Default
Title
Date - Oldest
Date - Newest
Author
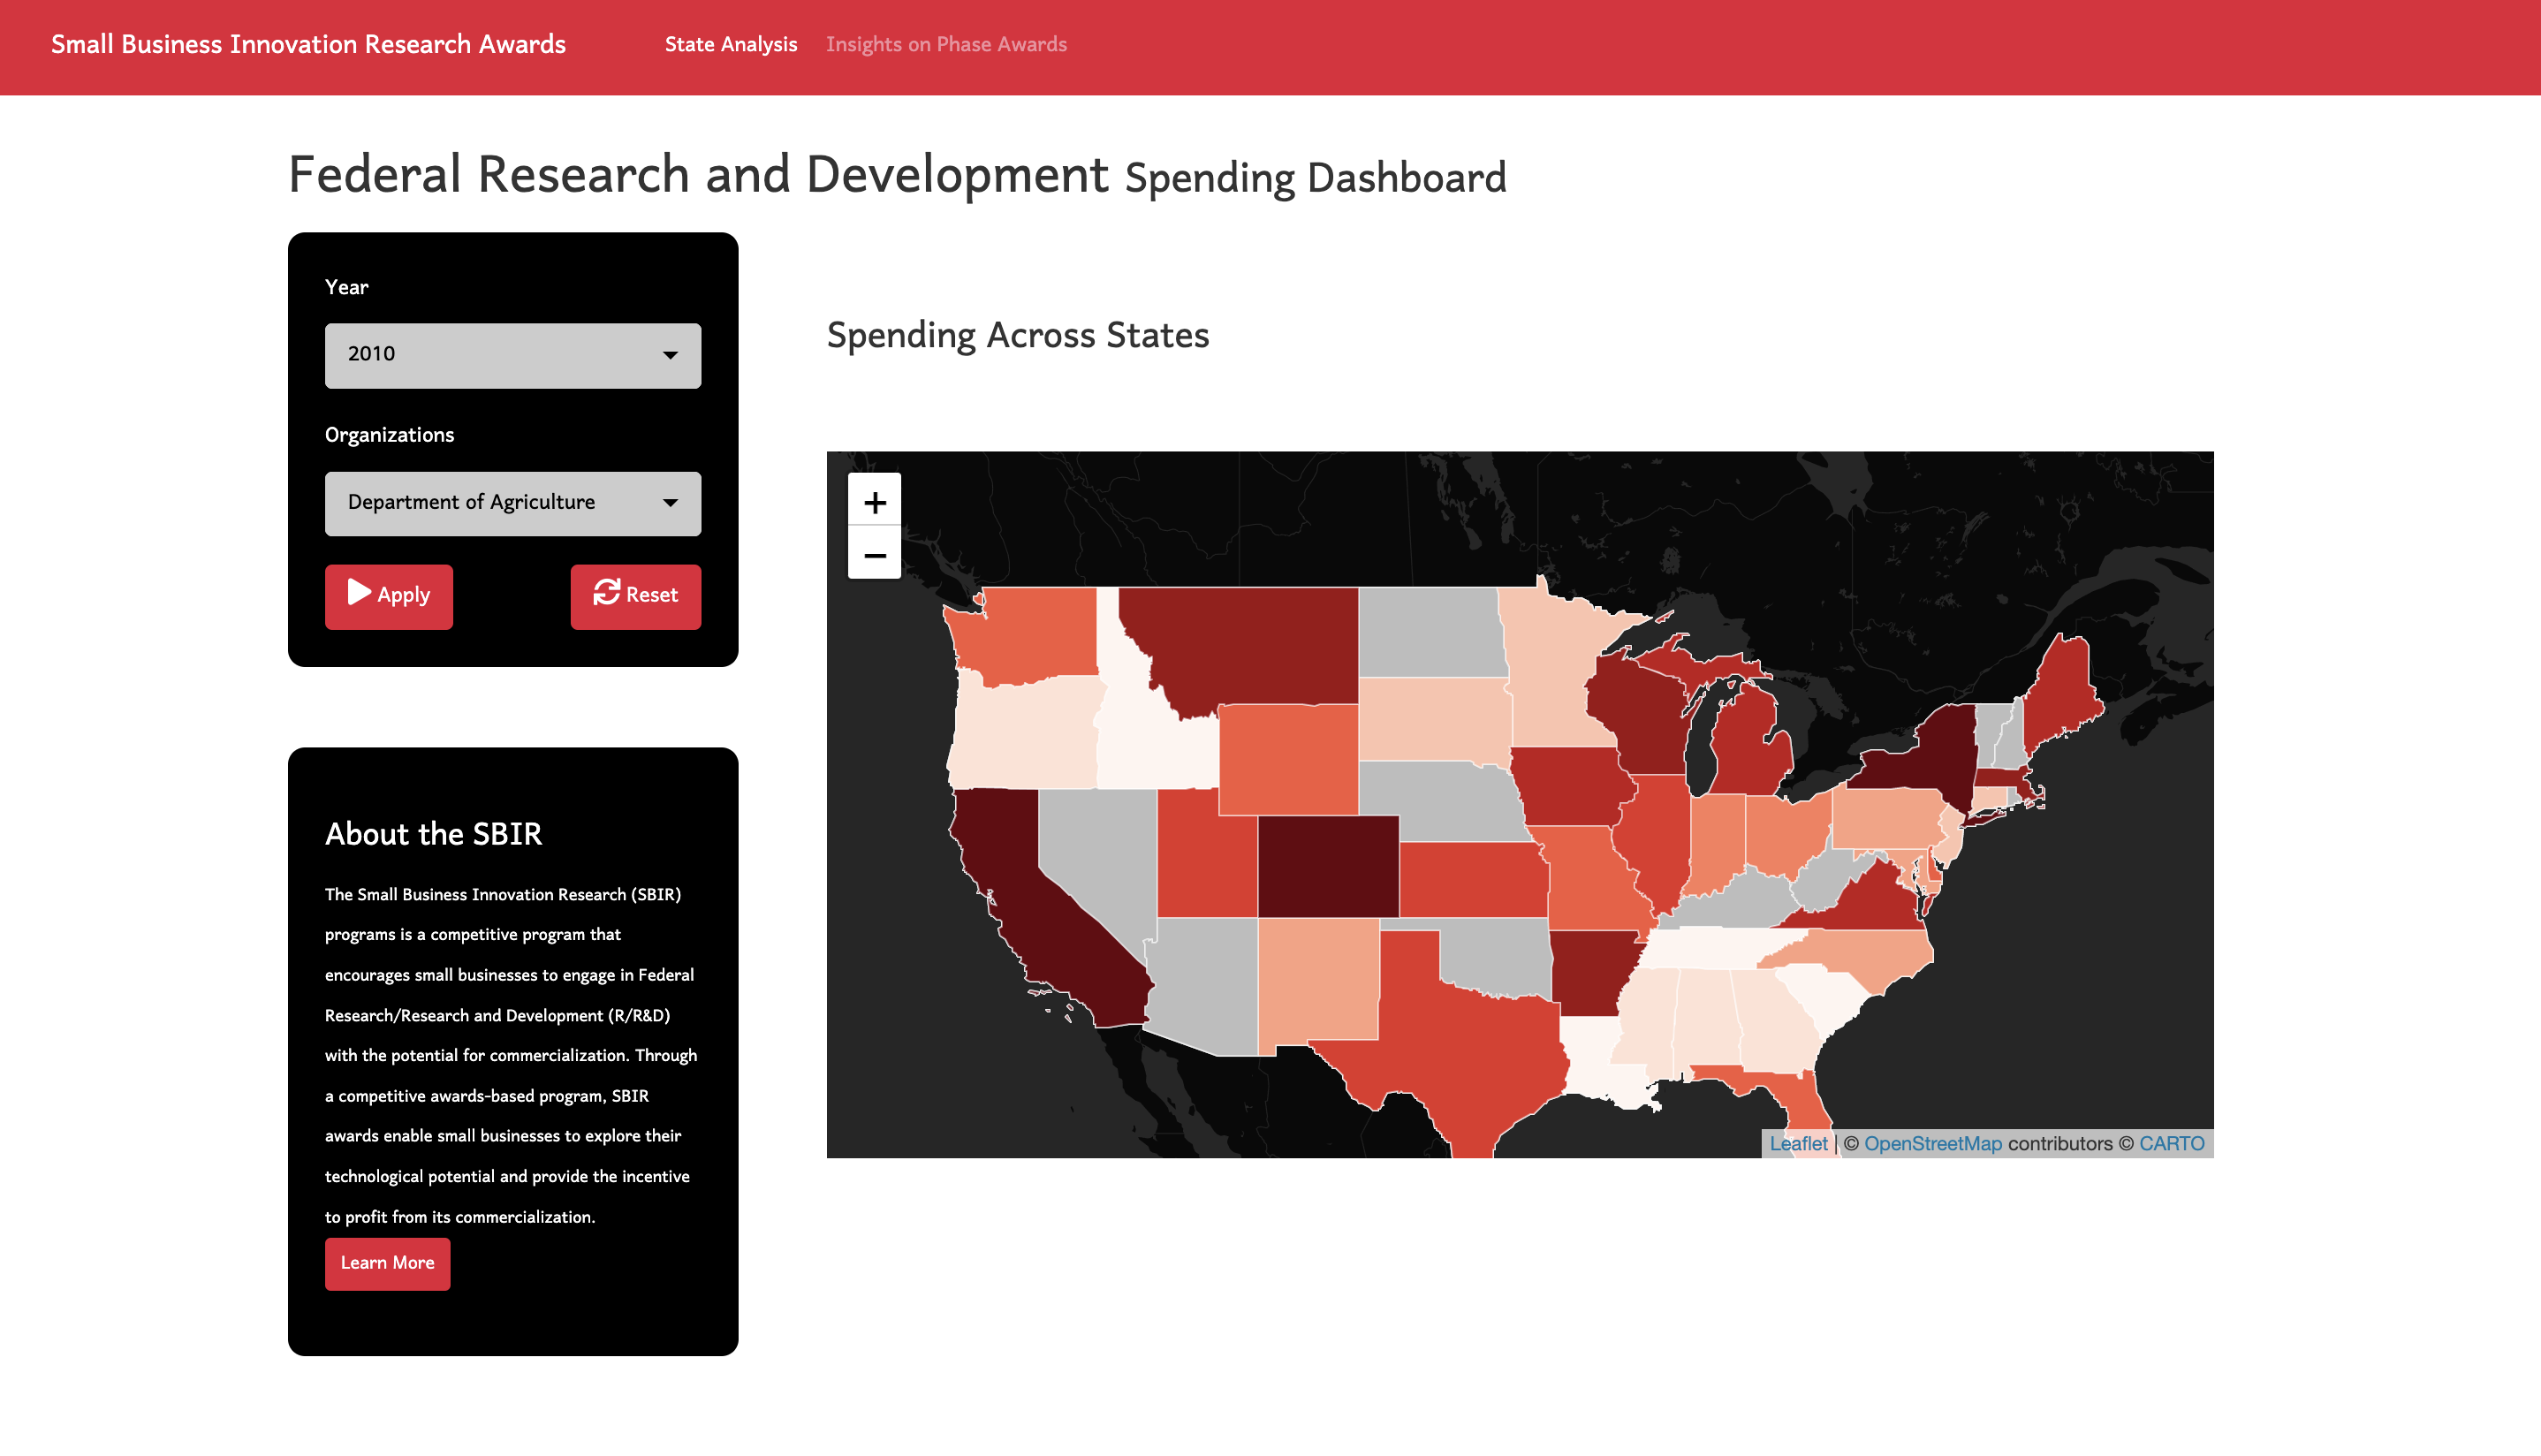
R Shiny: Small Business Innovation Research
leaflet
R Shiny
SBIR
R Shiny Dashboard to visualize the distribution of federal funding across different states and departments from 2010 to 2019 for SBIR.
Bhabishya Neupane
Mar 30, 2022
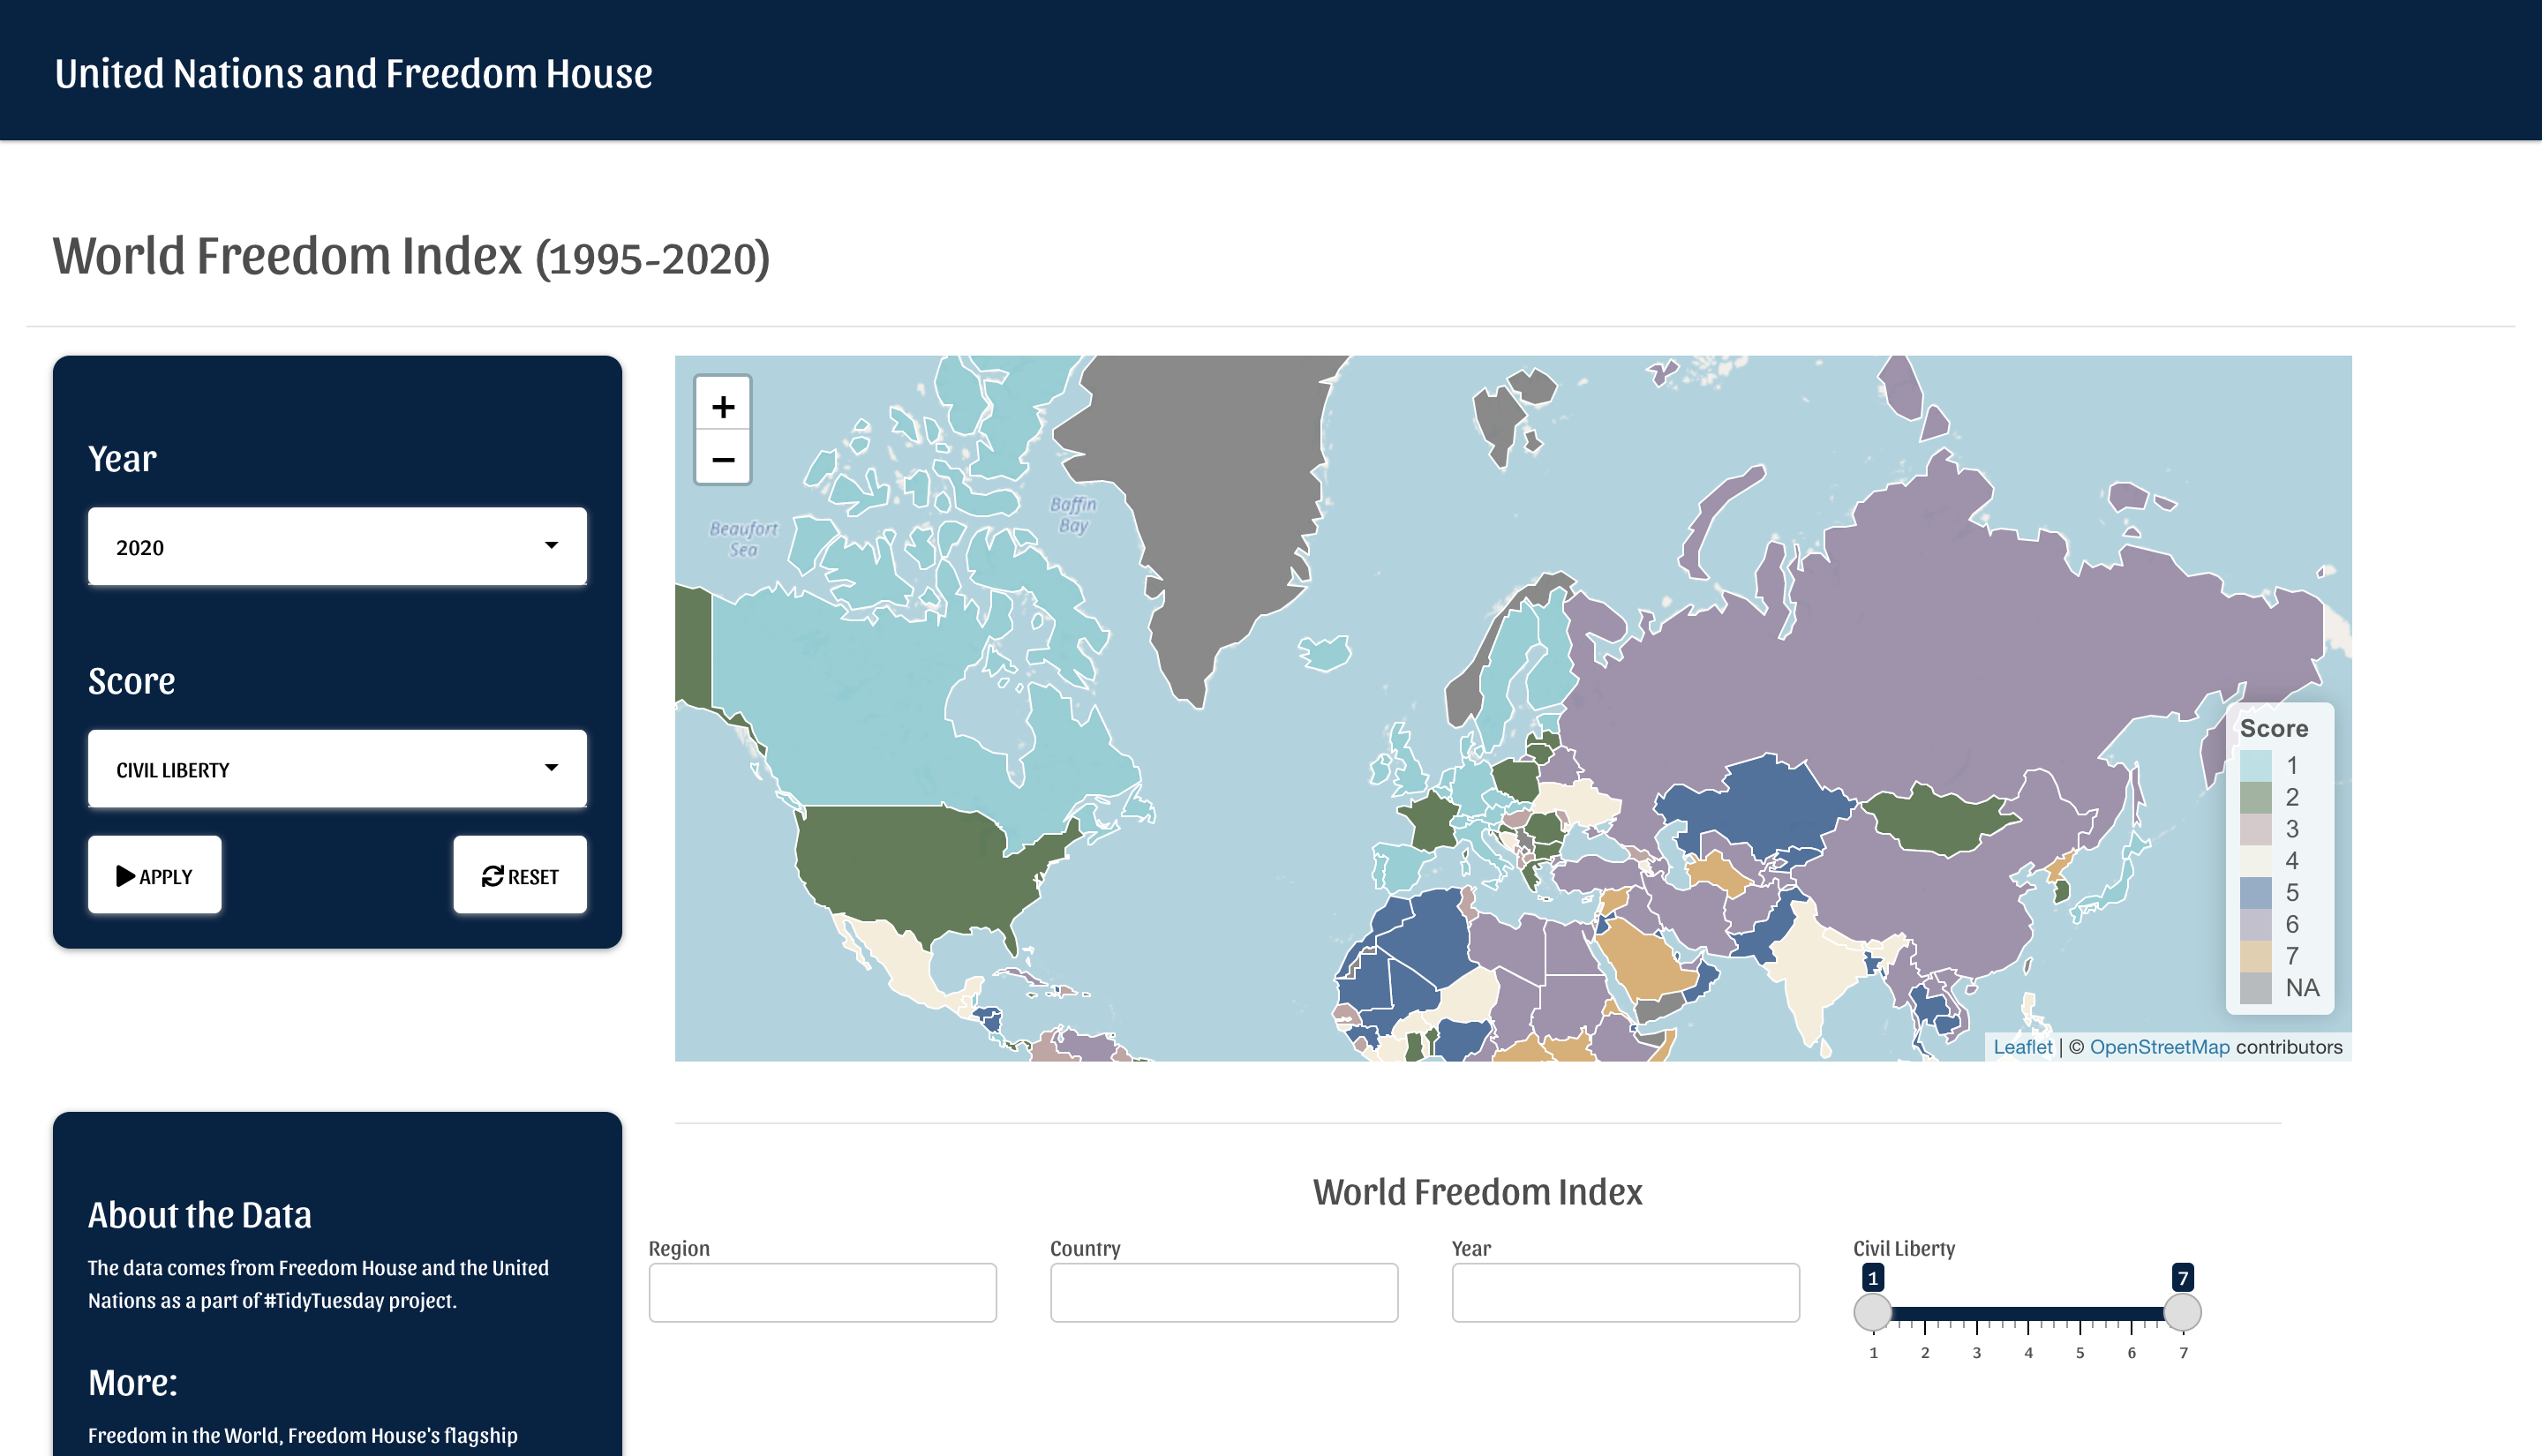
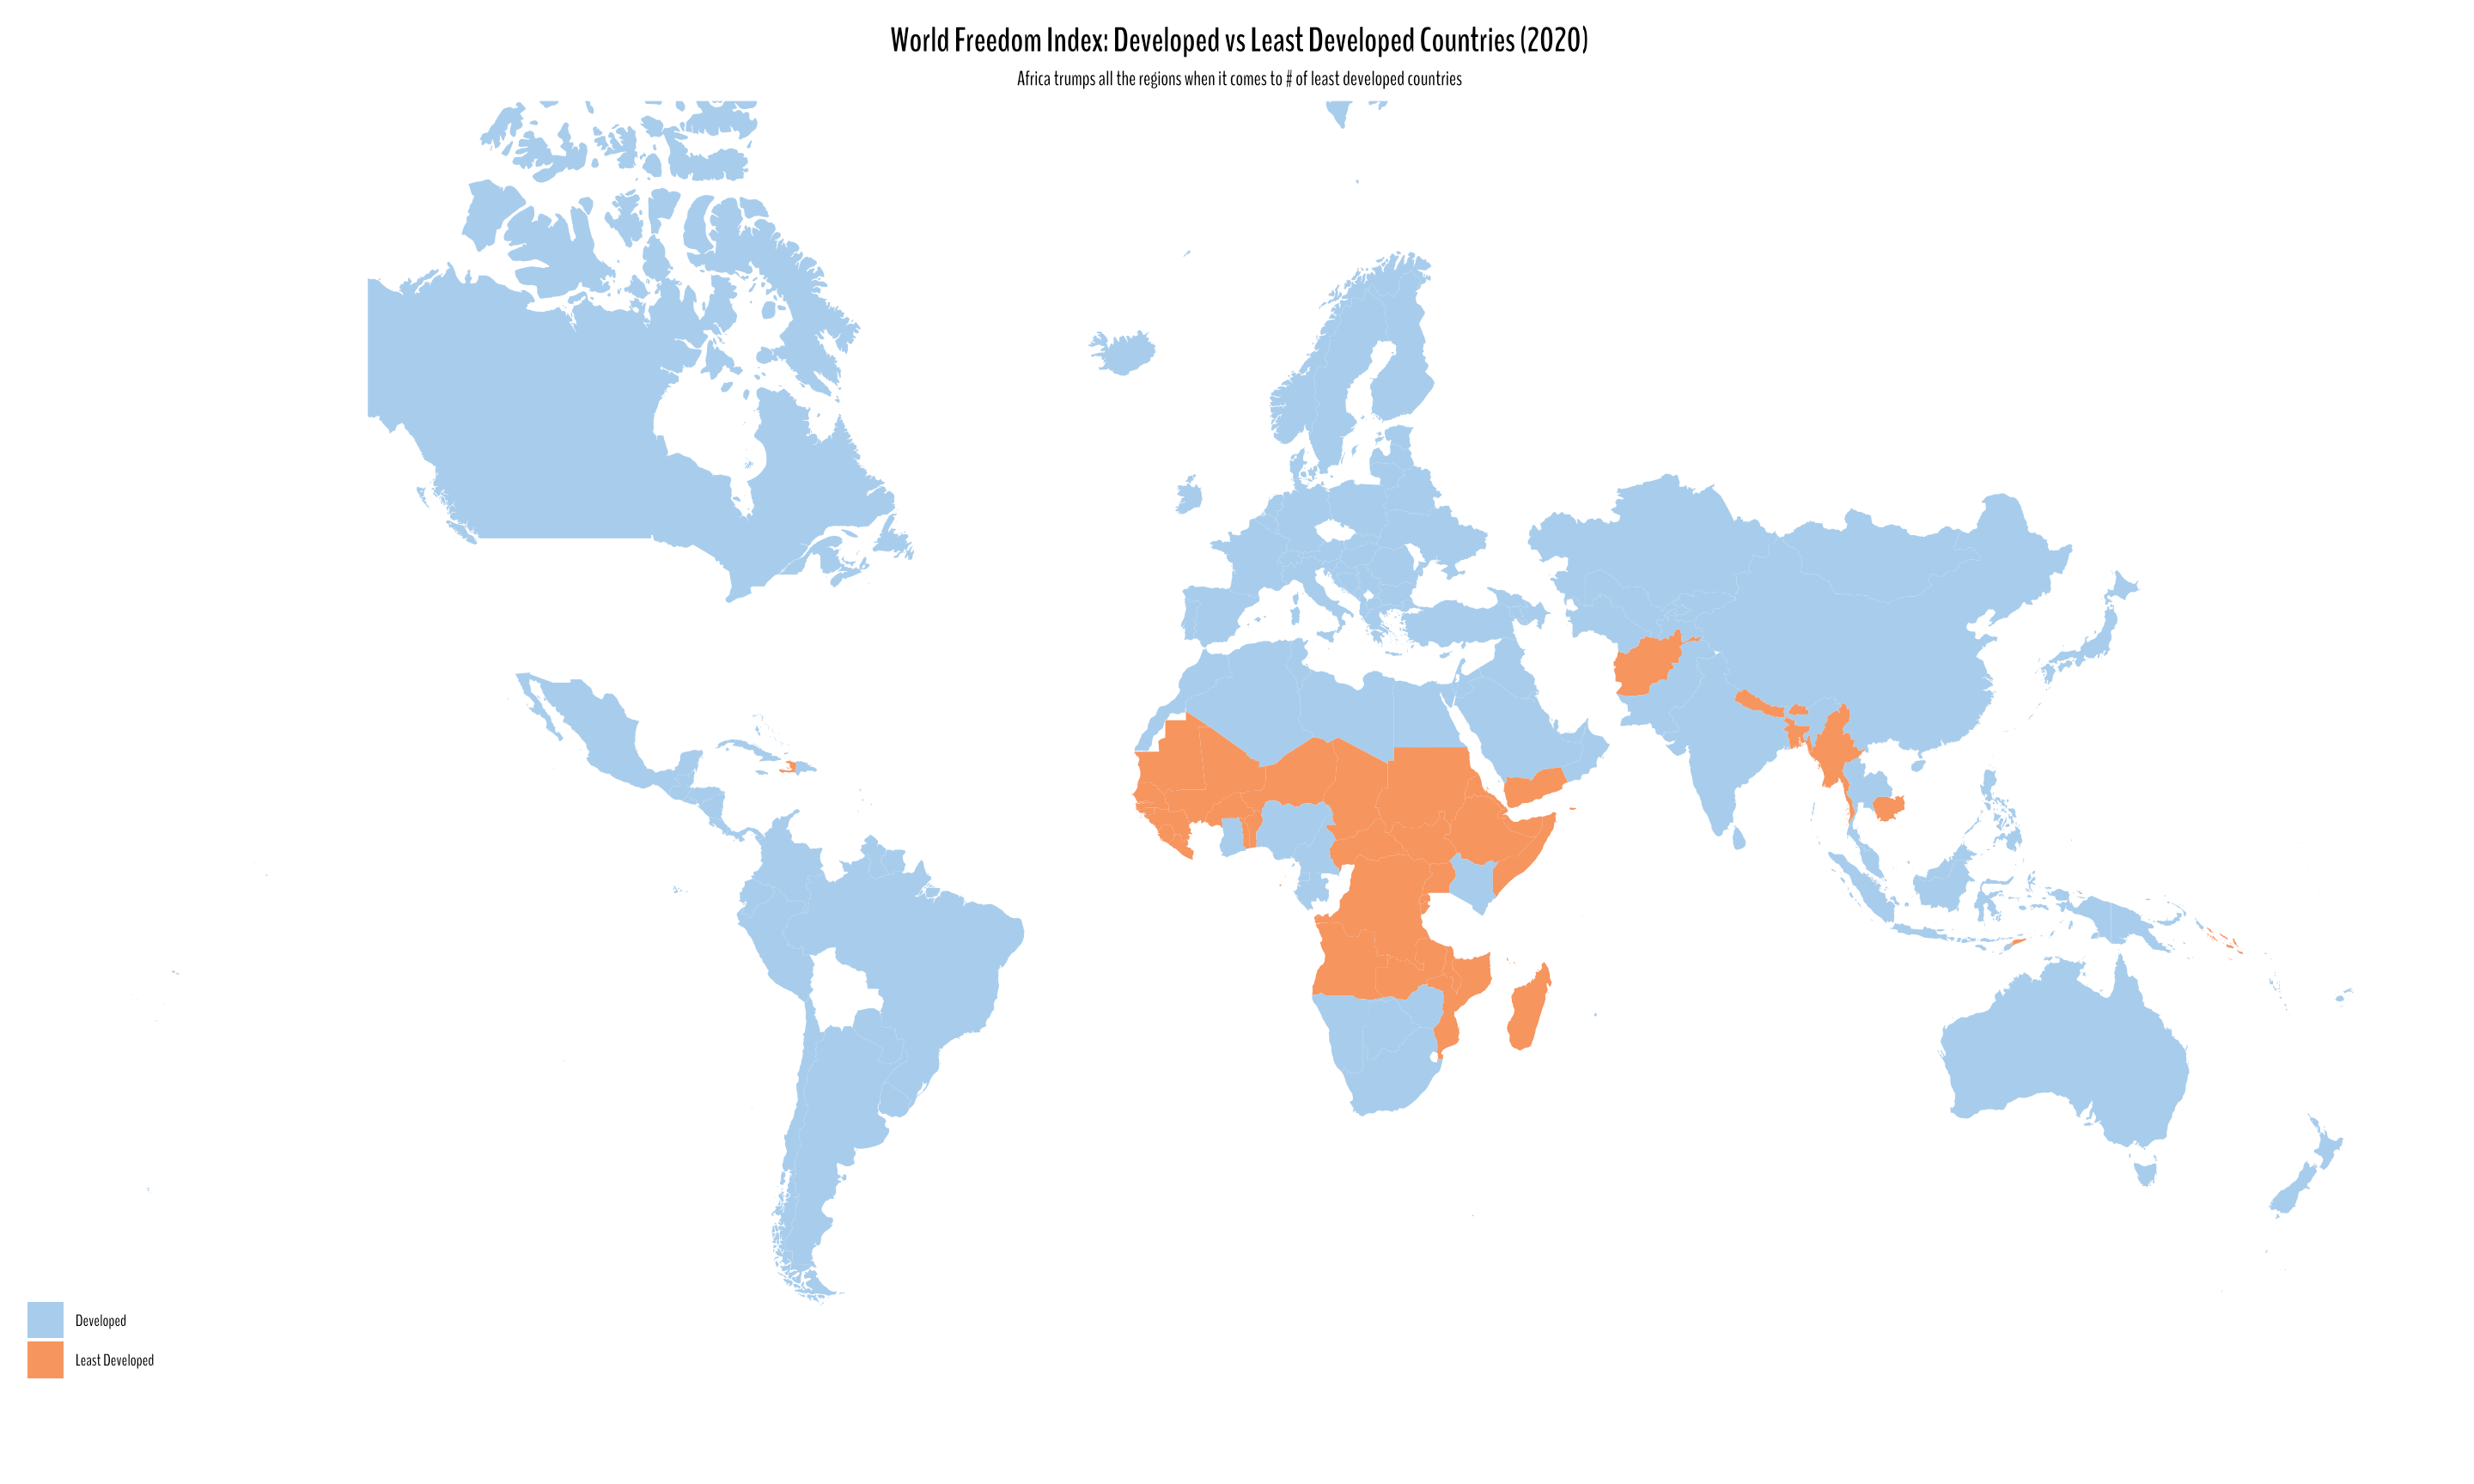
R Shiny Application: World Freedom Index
R Shiny
Tidy Tuesday
leaflet
reactable
reactablefmtr
crosstalk
Shiny Dashboard to visualize how World Freedom Index has over time across different regions of the world.
Bhabishya Neupane
Mar 28, 2022
{dairyplantdata} R data package
usethis
r package
pkgdown
This was built to faciliate research for senior economists at the University of Nebraska - Lincoln.
Bhabishya Neupane
Mar 28, 2022
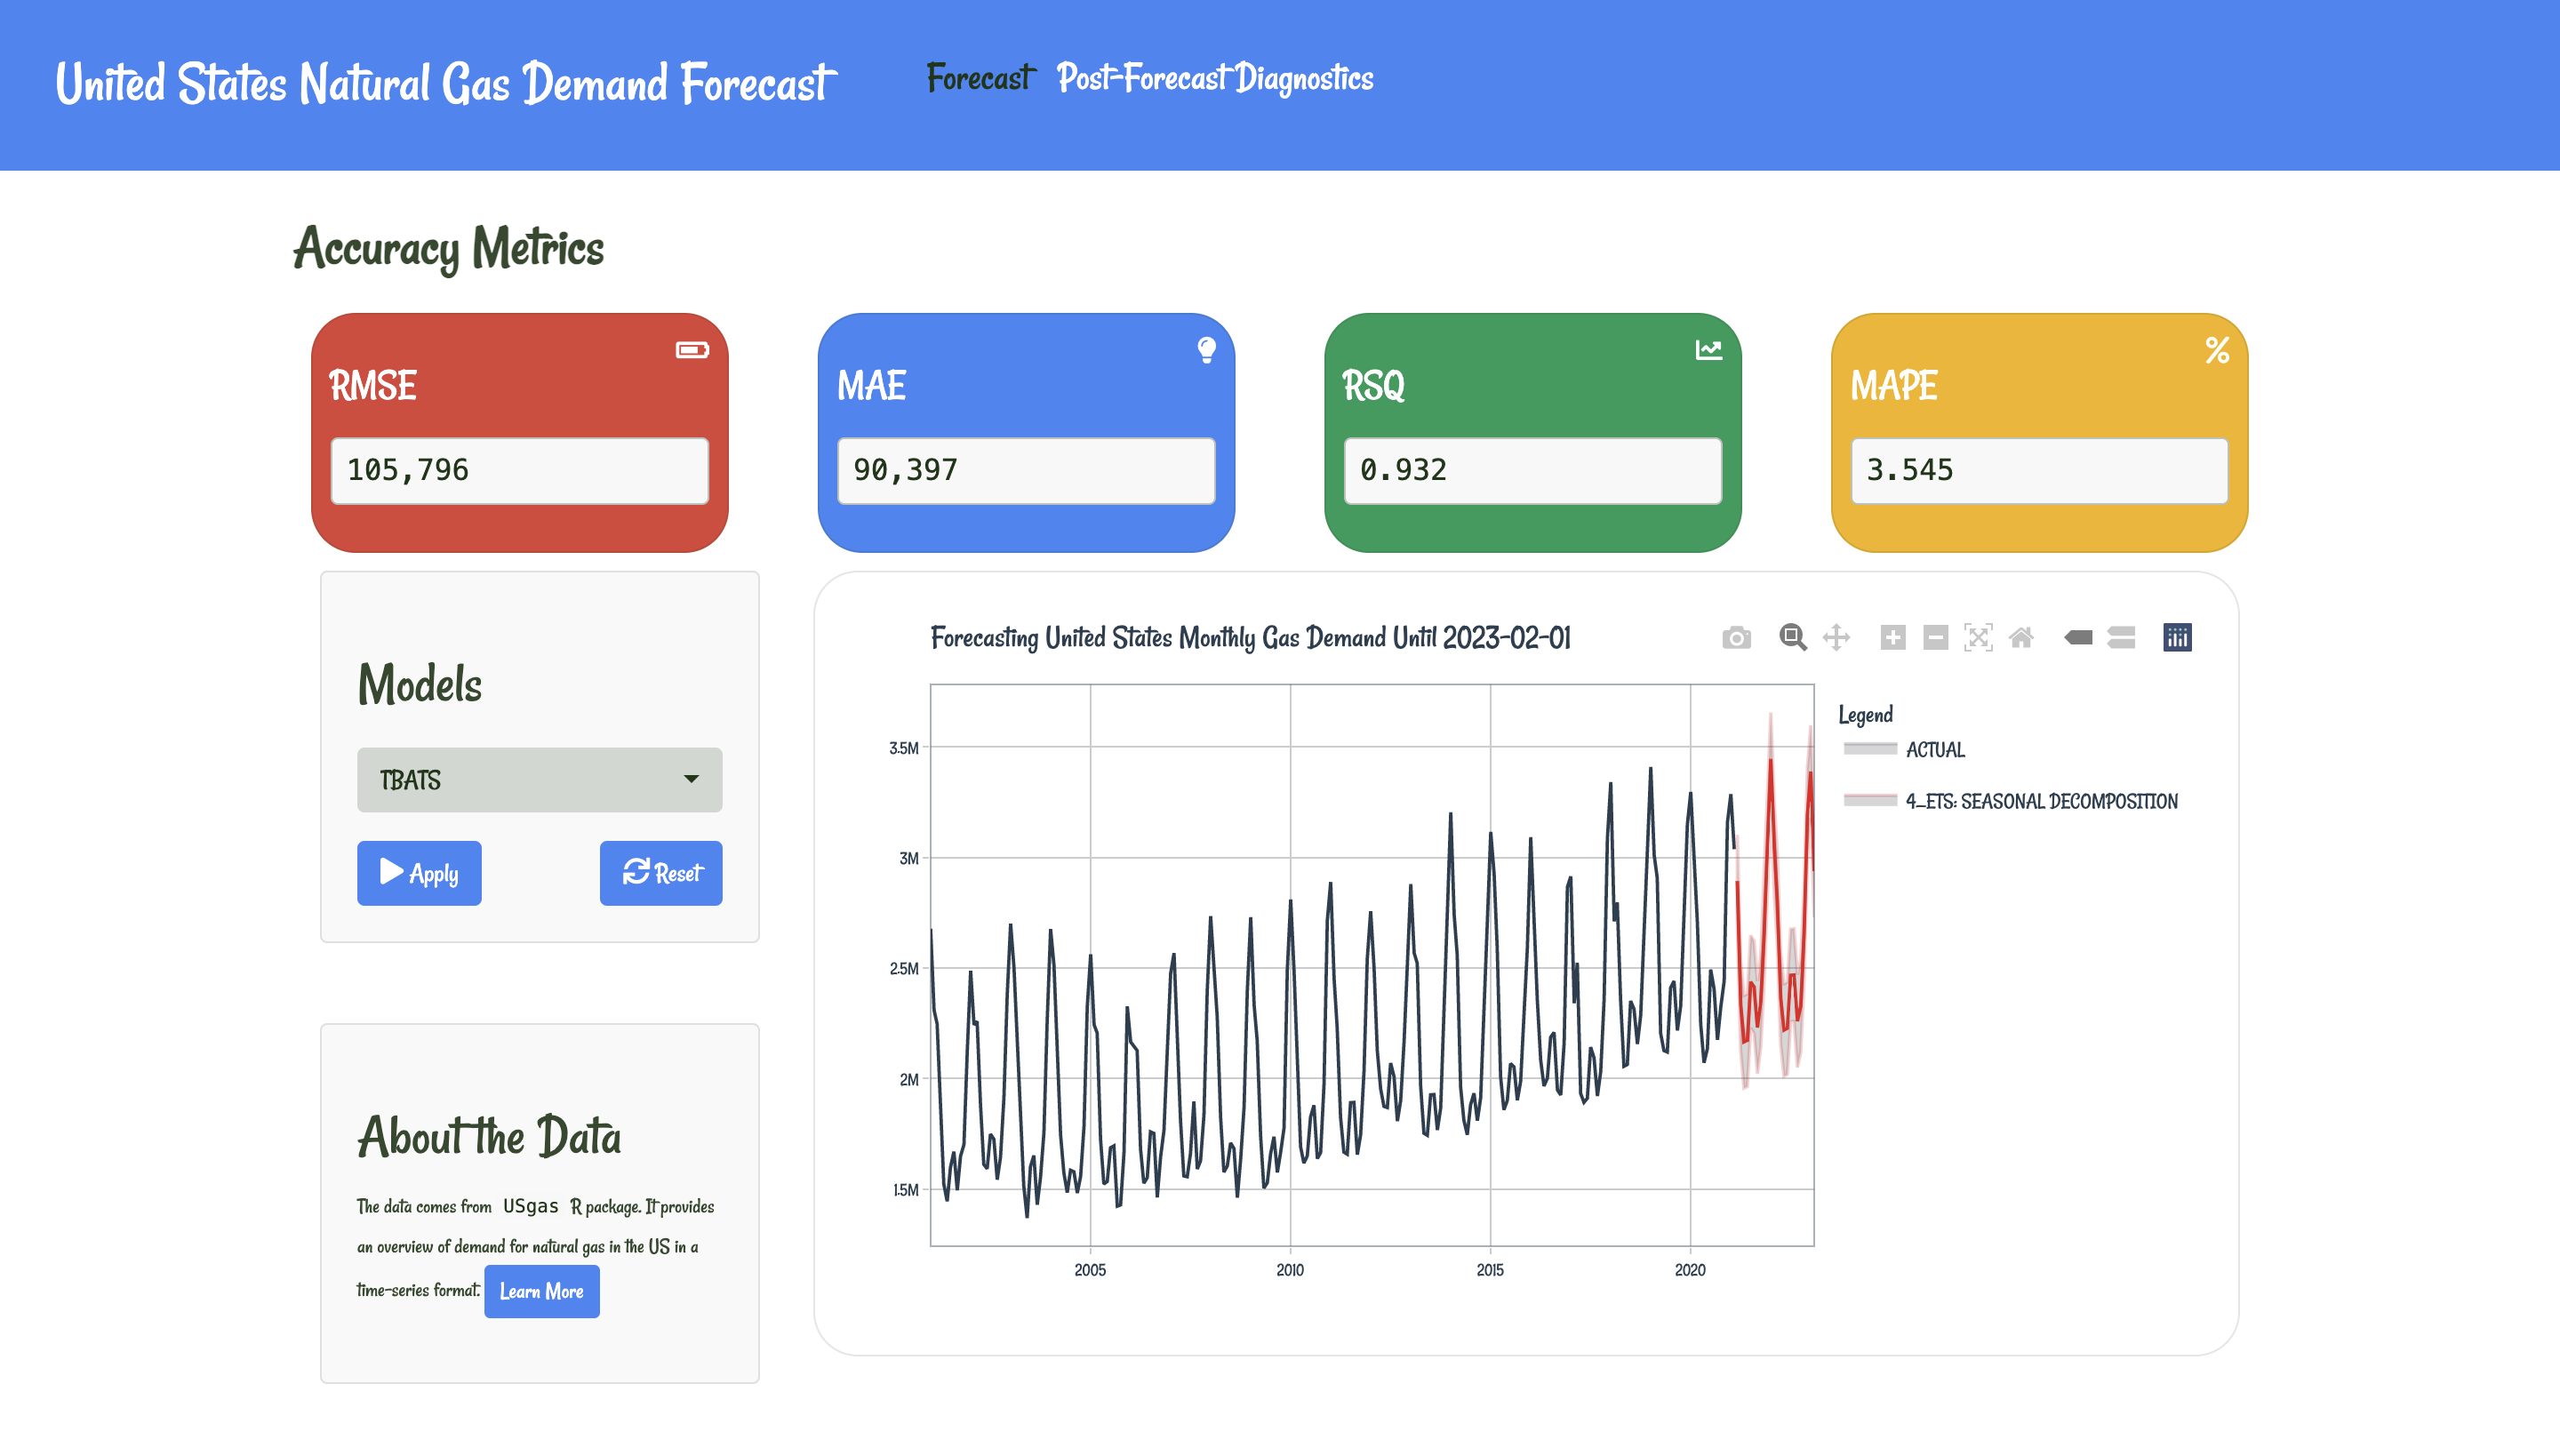
R Shiny Application: Natural Gas Demand Forecast
USgas
R Shiny
Time Series Forecasting
Forecasting monthly natural gas demand in the United States until 2023-01-01 using data from USgas package in R put together by Rami Krispin, Data Science and Engineering…
Mar 28, 2022
Tidy Tuesday: World Freedom Index
ggplot2
Tidy Tuesday
widyr
I will be exploring how civil liberty and political rights score has changed over time across different regions of the world.
Bhabishya Neupane
Mar 28, 2022
Tidy Tuesday: Chocolate Ratings
Tidy Tuesday
ggplot2
Visualizing and extracting information from chocolate ratings reviewed by The Manhattan Chocolate Society
Bhabishya Neupane
Mar 27, 2022
Tidy Tuesday: Art Collection
Tidy Tuesday
infer
I will be exploring infer package for statistical inference.
Bhabishya Neupane
Mar 26, 2022
No matching items